The exploits
database.
A list of CVEs is easy. Knowing which ones are being exploited, who by, whether public code exists, and how to defend yourself, is the work. ThreatCluster does that work for you.
Patch what matters first.
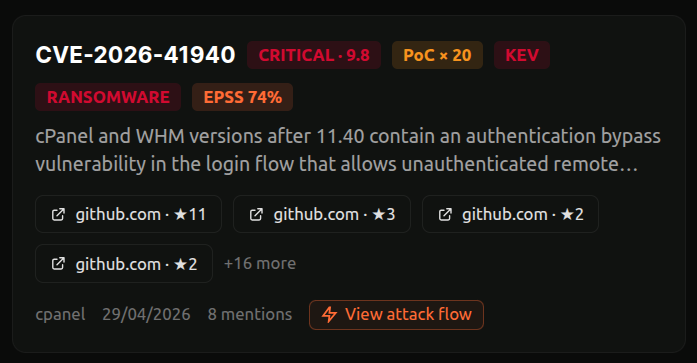
We rank vulnerabilities by what defenders care about: known exploitation, predicted exploitation, ransomware use, and news coverage. The result is a list you can work top-down, instead of a CVSS dump you have to triage yourself.
Filter by severity, by KEV listing, by ransomware activity, or by the products and vendors in your environment. Search for any CVE, vendor, or product to jump straight in.
- Sort by exploitation, mentions, EPSS, CVSS, or recency
- Match against your stack, not the whole world's
- Updated daily from KEV, EPSS, and public exploit sources
 click to expand
Read the situation in 30 seconds.
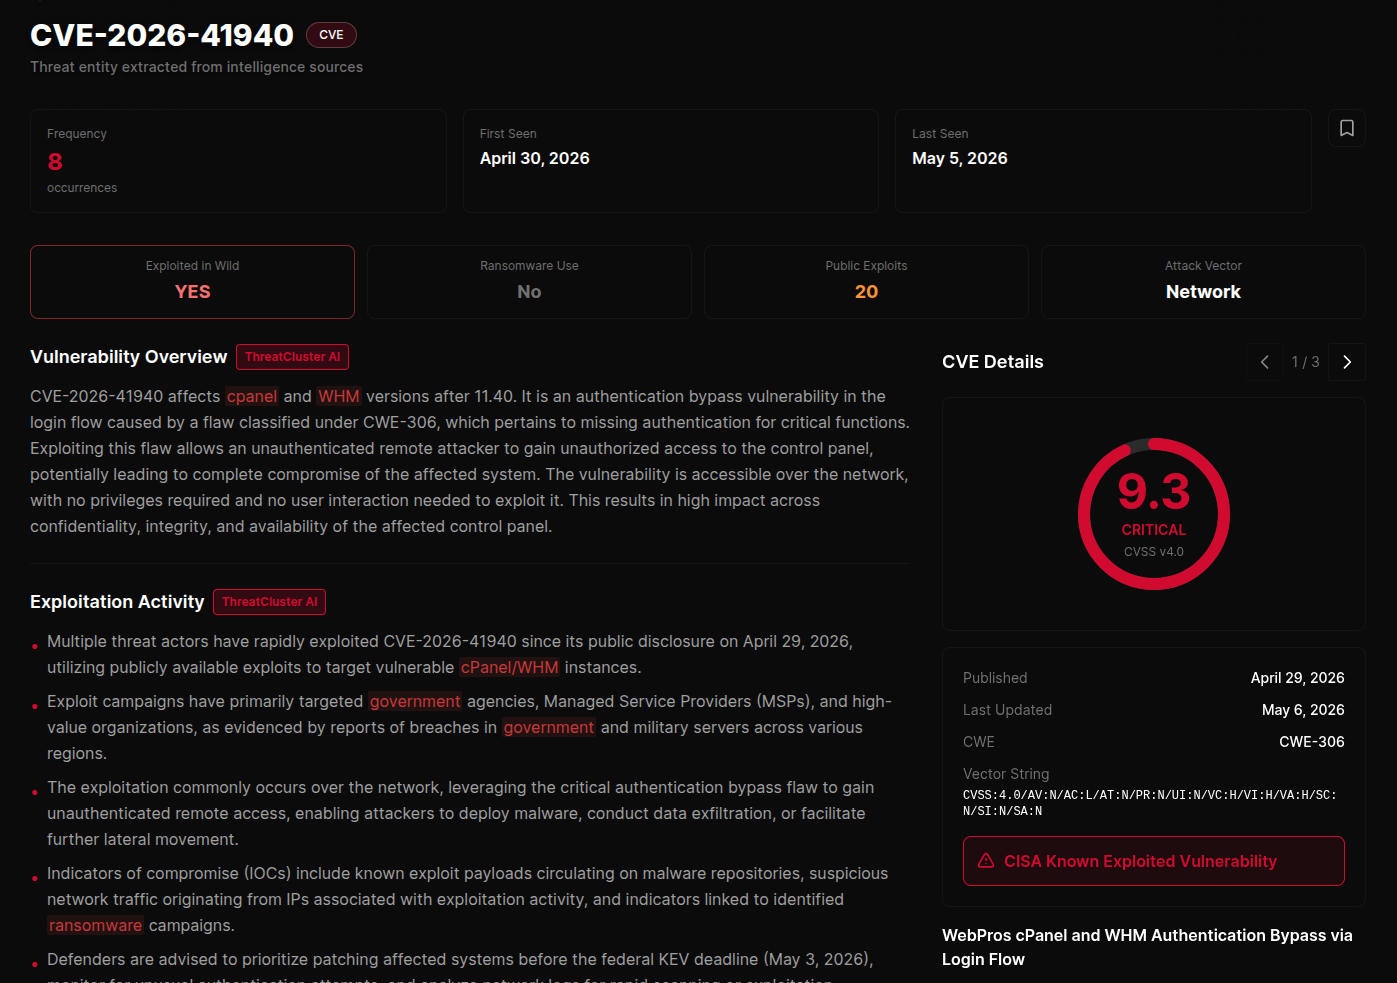
Every CVE opens with a plain-English summary of the exploitation activity around it. The disclosure, the patch timing, who's been hit, which campaigns are using it, and whether KEV has caught up. No reading three articles to piece it together.
Vendors, threat actors, and malware families are linked, so you can pivot to anything relevant without losing your place. The summary updates as the situation does.
 click to expand
See who it's hitting.
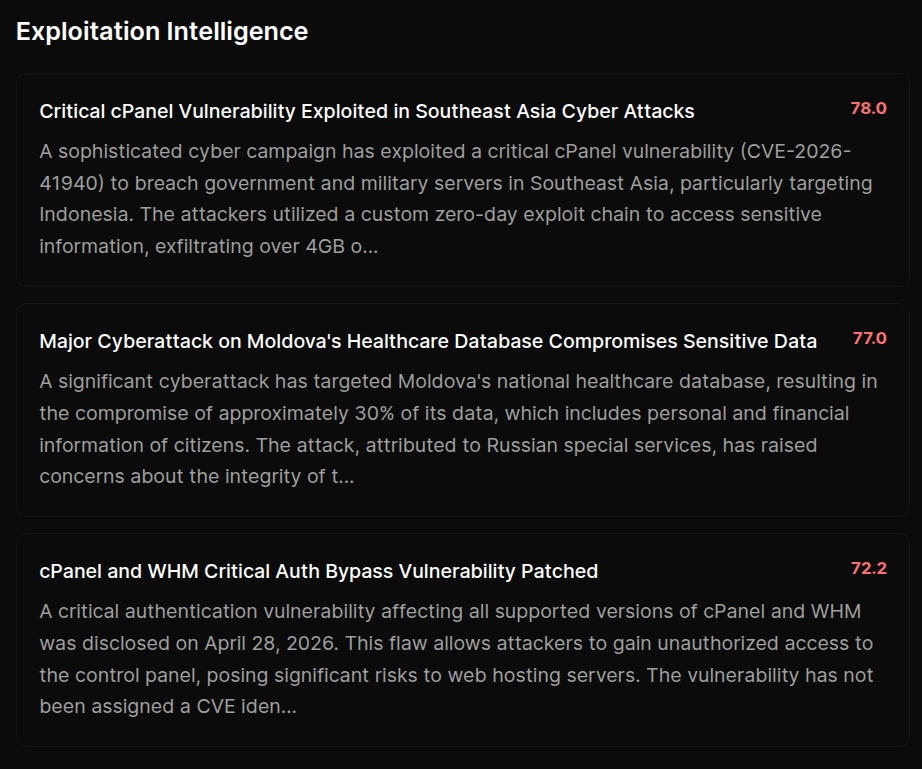
Below the summary you'll find the active campaigns that have picked up the vulnerability, ranked by severity. Each one is a written-up incident with victims, attribution, and source articles, one click away.
This is what tells you whether you're looking at a theoretical bug or something that's already breaking into organisations like yours.
 click to expand
Know if the exploit is public.
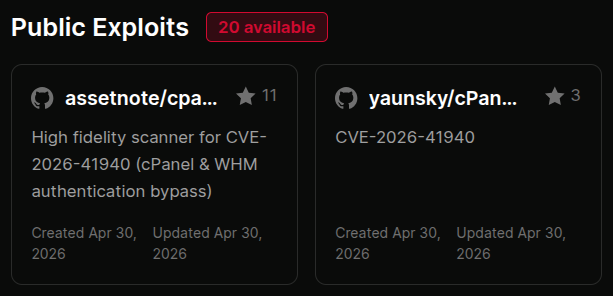
The moment proof-of-concept code lands in public, the clock starts. ThreatCluster surfaces the available PoCs alongside the CVE, with star counts and dates so you can tell research from weaponised code at a glance.
If nothing public exists yet, this part of the page stays quiet. You only see it when it matters.
 click to expand
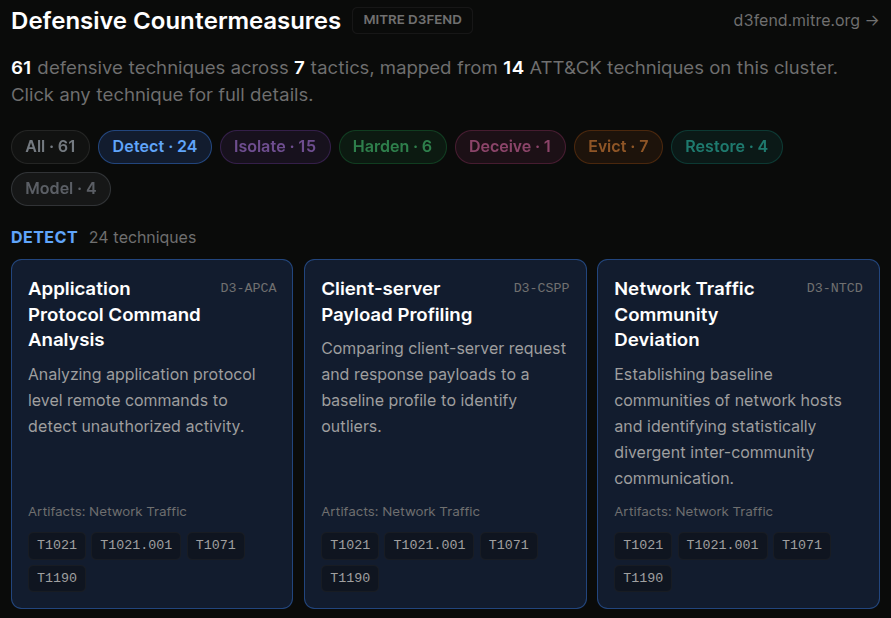
Know what to do about it.
Most CTI tells you what attackers did. ThreatCluster also tells you what to do about it, using MITRE D3FEND, the defensive counterpart to ATT&CK. We group the relevant countermeasures into the actions a defender can take: detect, isolate, harden, deceive, evict, or restore.
Click any technique to read how it works, where it applies, and what to watch out for, all without leaving the page.
 click to expand
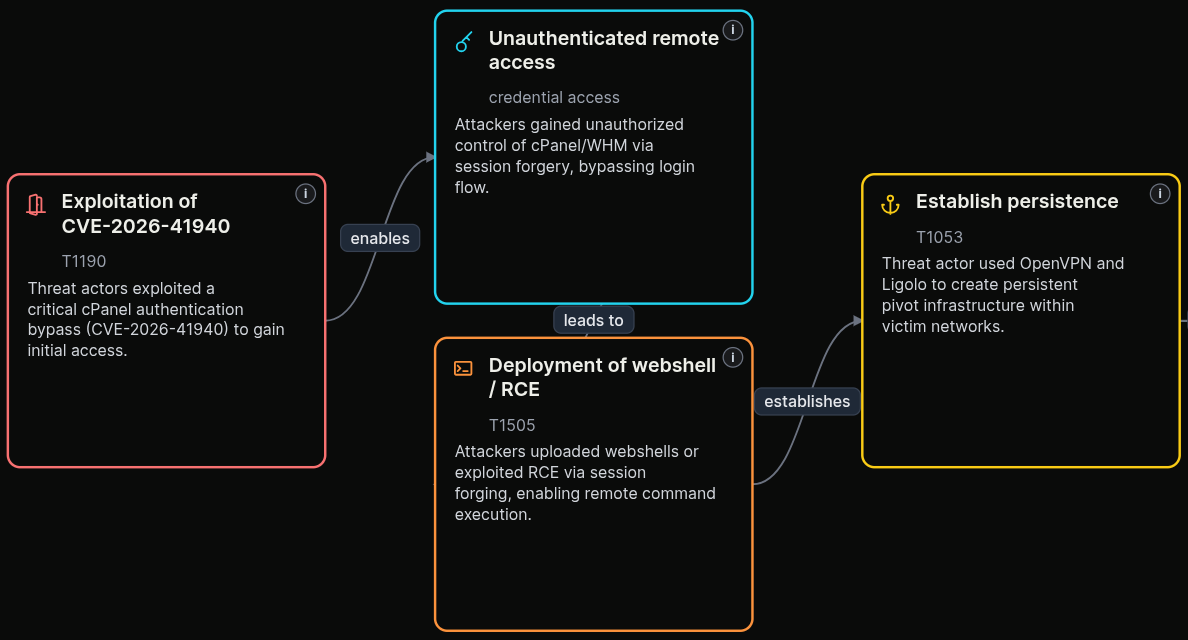
See the full attack at a glance.
The attack flow shows how the vulnerability is used in practice, from the first foothold through to impact. It's a visual walk-through of the exploit chain that an analyst could brief from in a meeting, not a wall of text.
Export the flow as an image for a report, or as a STIX bundle for the tooling your team already uses.
 click to expand
Everything you need on a CVE,
in one place.
The exploitation activity, the campaigns, the public code, the defences, the attack flow. One page, kept current.