Click any entity. Get the full picture.
Every threat actor, malware family, tool, CVE, vendor, and technique mentioned anywhere on the platform has its own intelligence page. Built from the platform's own data, not a static reference book.
The full intelligence page.
AI-generated overview, recent events, threat profile, and frequency tracking from first seen to last seen. Drawn from the intelligence the platform has collected on this entity, not from a third-party threat database.
The threat profile covers capabilities, delivery methods, targeted platforms, target regions, target sectors, common TTPs, associated campaigns, and associated CVEs. Every section is derived from co-occurrence in the cluster data.
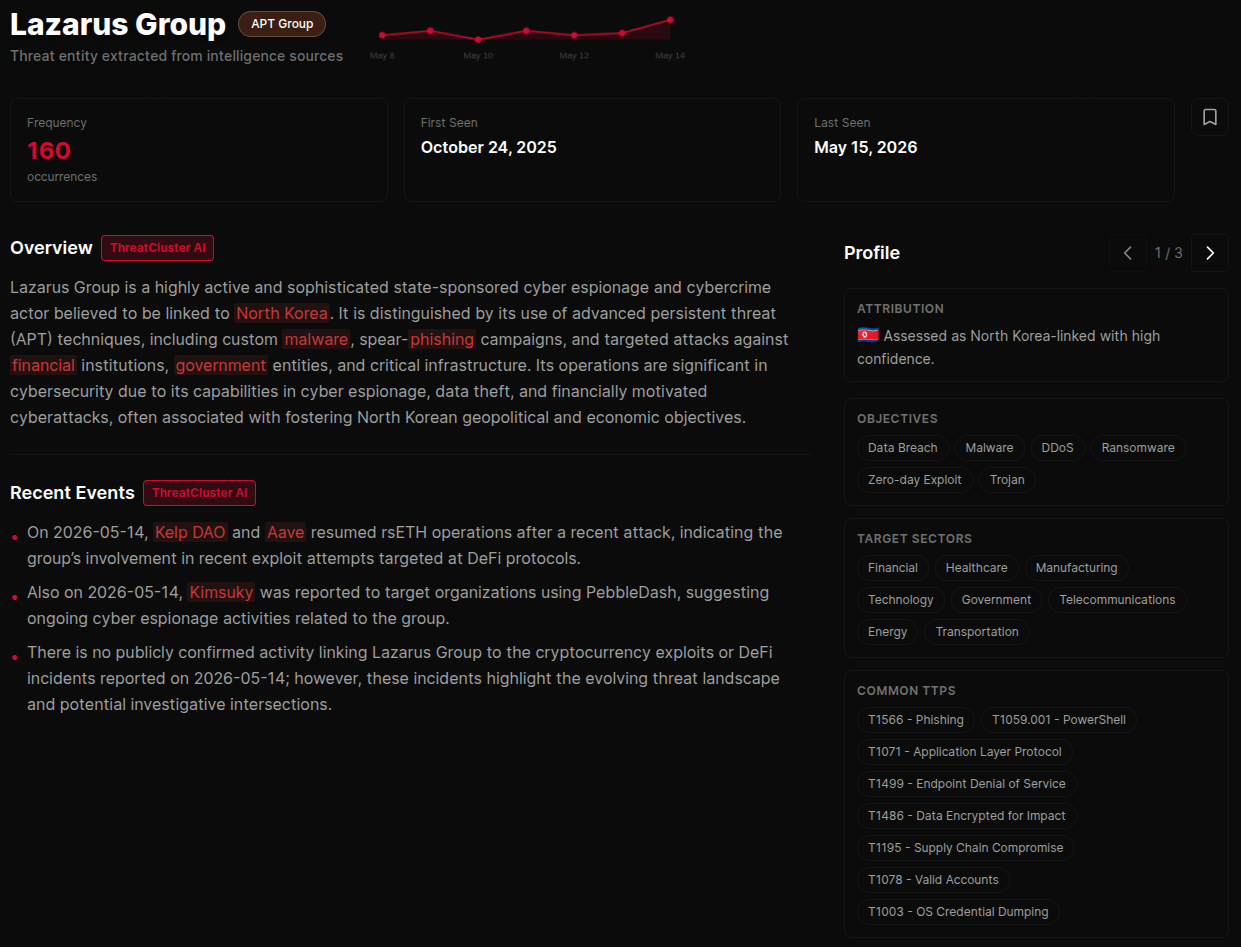 click to expand
Living, not static.
Every entity profile updates as new clusters land. New campaign mentioning this APT? It surfaces in the recent events block within minutes. New malware family observed in the same campaigns? It appears in the relationship graph on the next render.
Frequency charts plot mentions over time so you can see when an entity went quiet, when it returned, and when its activity spiked.
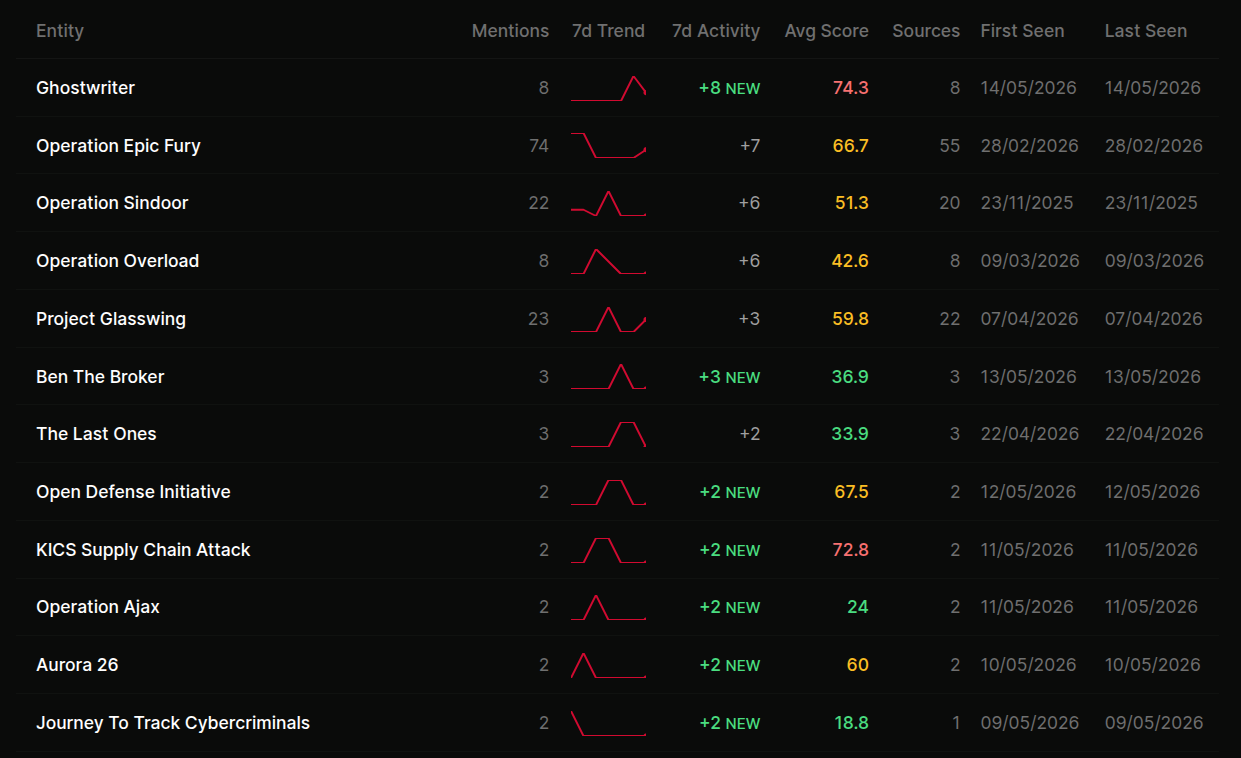 click to expand
Relationship graph.
Every entity page maps its connections to other entities visually. Which threat actors use which malware. Which malware targets which platforms. Which CVEs are associated with which campaigns.
Explore laterally across the graph to find connections that aren't obvious from reading individual clusters. A tool used by three unrelated APTs is a story; a malware family targeting the same six platforms across a year is a pattern.
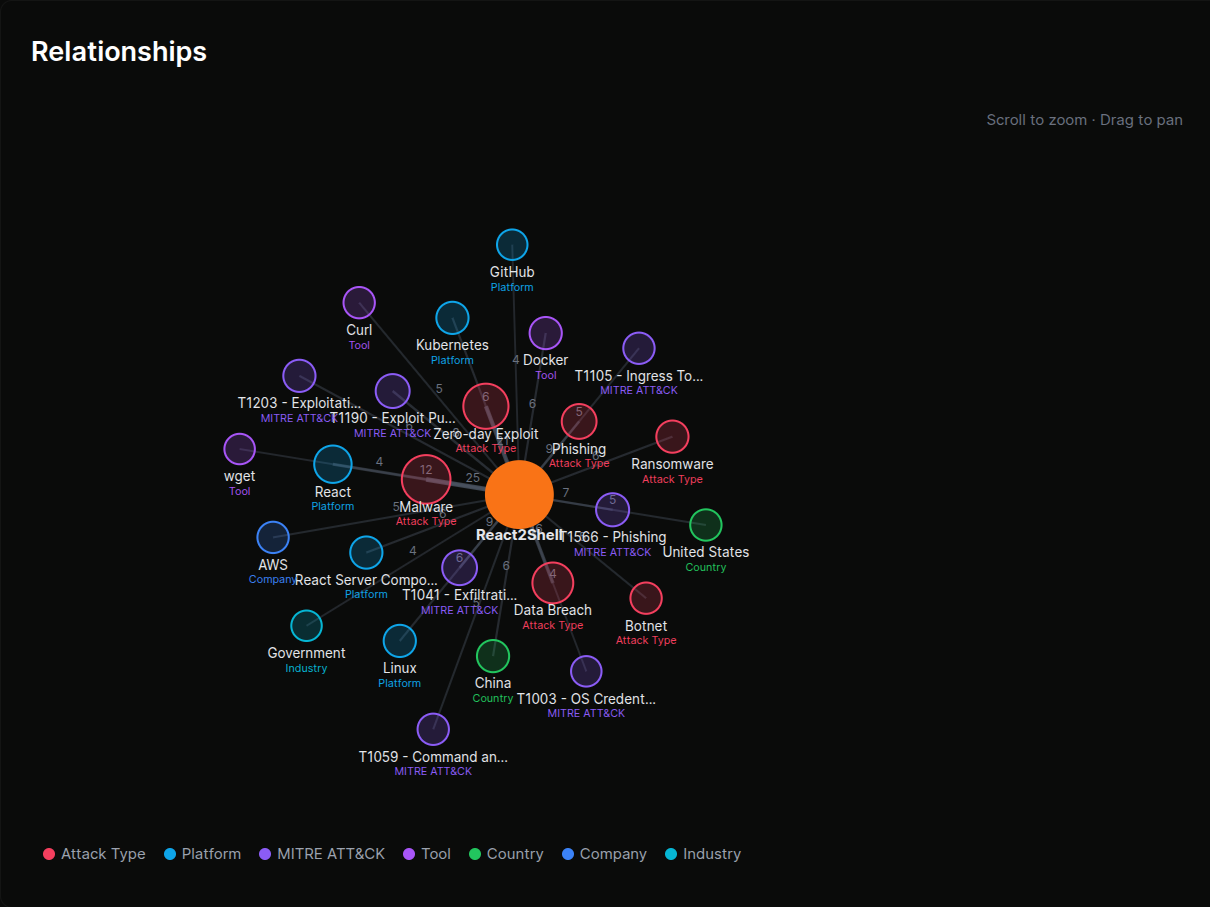 click to expand
Searchable, browseable, exportable.
Search by name across every entity type. Browse by category, by frequency, or by recent activity. Export individual entity profiles as JSON, or pull the underlying relationship data via the REST API for downstream graph analysis.
For IOC-type entities (IPs, domains, hashes, emails, crypto wallets), the entity page also surfaces the AI confidence verdict and the underlying reason. See IOCs and Exports for the validation pipeline.
 click to expand
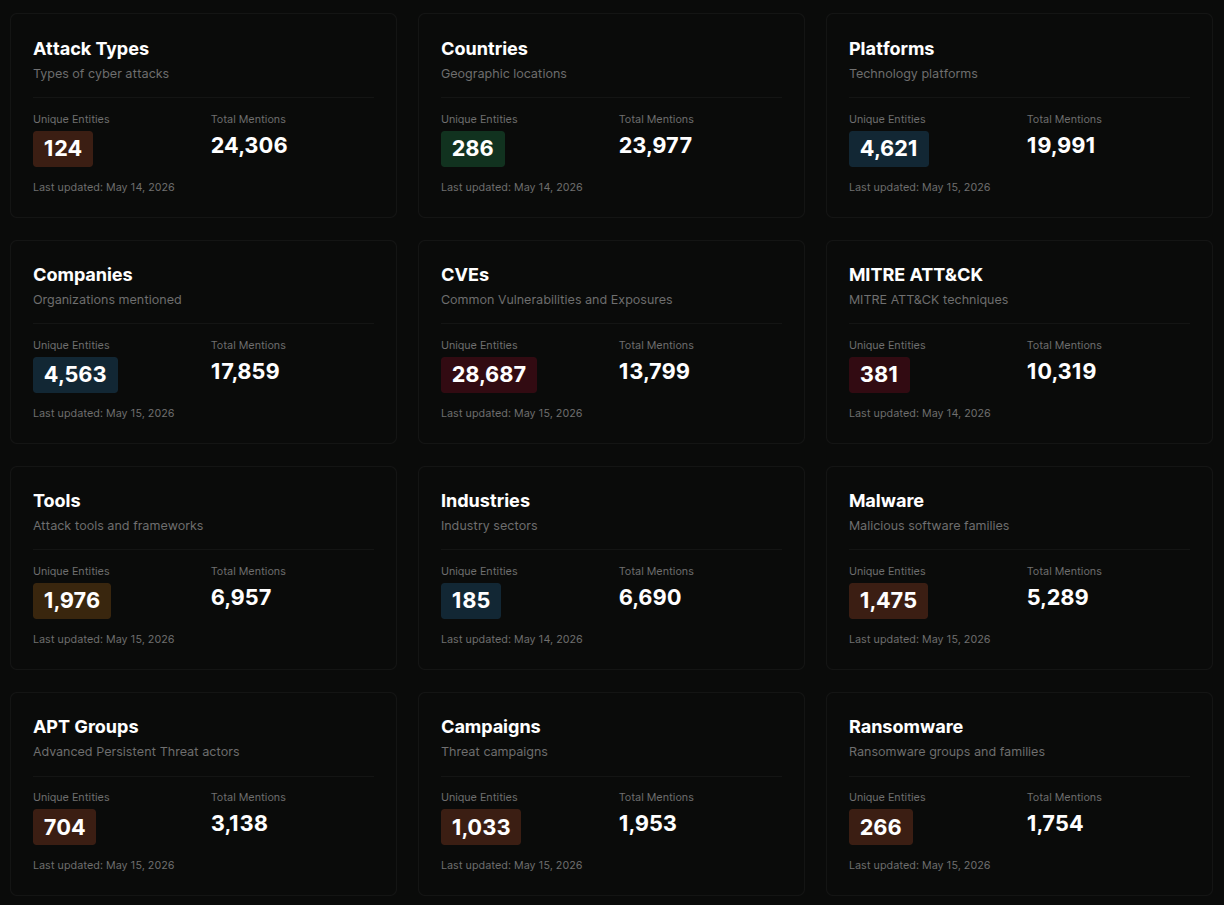
Browse the database by type
Every entity type has its own hub, each listing the most active entities of that type with a profile page behind every one. This is the front door to the full threat database.
- APT groupsState-aligned and named threat actors, with the campaigns and tooling attributed to each
- Ransomware groupsActive ransomware and extortion crews, their victims and leak-site activity
- MalwareMalware families and the actors, campaigns and platforms they touch
- CampaignsNamed intrusion campaigns and the entities that make them up
- CompaniesVendors and organisations as they appear across reporting and incidents
- PlatformsProducts and technologies, and the CVEs and activity affecting them
- IndustriesSectors, with the threats and clusters that target each
- Entity explorerSearch and browse across all 21 entity types at once
More of the platform
- Real-Time ClusteringHow the threat graph is built
- Exposure ManagementAsset inventory ranked by CISA SSVC
- Threat HuntingIndustry threat models with SIEM-ready queries
- IOCs and ExportsSTIX, MISP, SIEM ingestion
- ThreatCluster AIInvestigation assistant with inline citations
- CLI and HeadlessREST API, tc command, agent tool
Entity intelligence FAQ
What is an entity in ThreatCluster?
Anything the platform tracks as a first-class record: threat actors, malware families, campaigns, vendors, products, CVEs, sectors, regions and IOC types. There are 21 entity types in total.
What is on an entity page?
An AI overview, recent events, a threat profile, frequency tracking over time, and a relationship graph mapping the entity's connections to other entities. It updates as new reporting lands rather than being a static reference.
What does the relationship graph show?
Inferred connections between entities, so a malware family links to the actors that use it, the platforms it targets and the campaigns it appears in. A tool used by three unrelated actors is a story; a malware family hitting the same six platforms across a year is a pattern.
Can I export entity data?
Yes. Individual profiles export as JSON, and the underlying relationship data is available via the REST API for downstream graph analysis.
How do I browse the full database?
Each entity type has its own hub (APT groups, ransomware groups, malware, campaigns, companies, platforms, industries), and the entity explorer searches across all types at once.
Every entity. Every connection. One page.
Drawn from the intelligence the platform has collected, not copied from a third-party reference book. Updates as the situation does.