One incident,
one cluster.
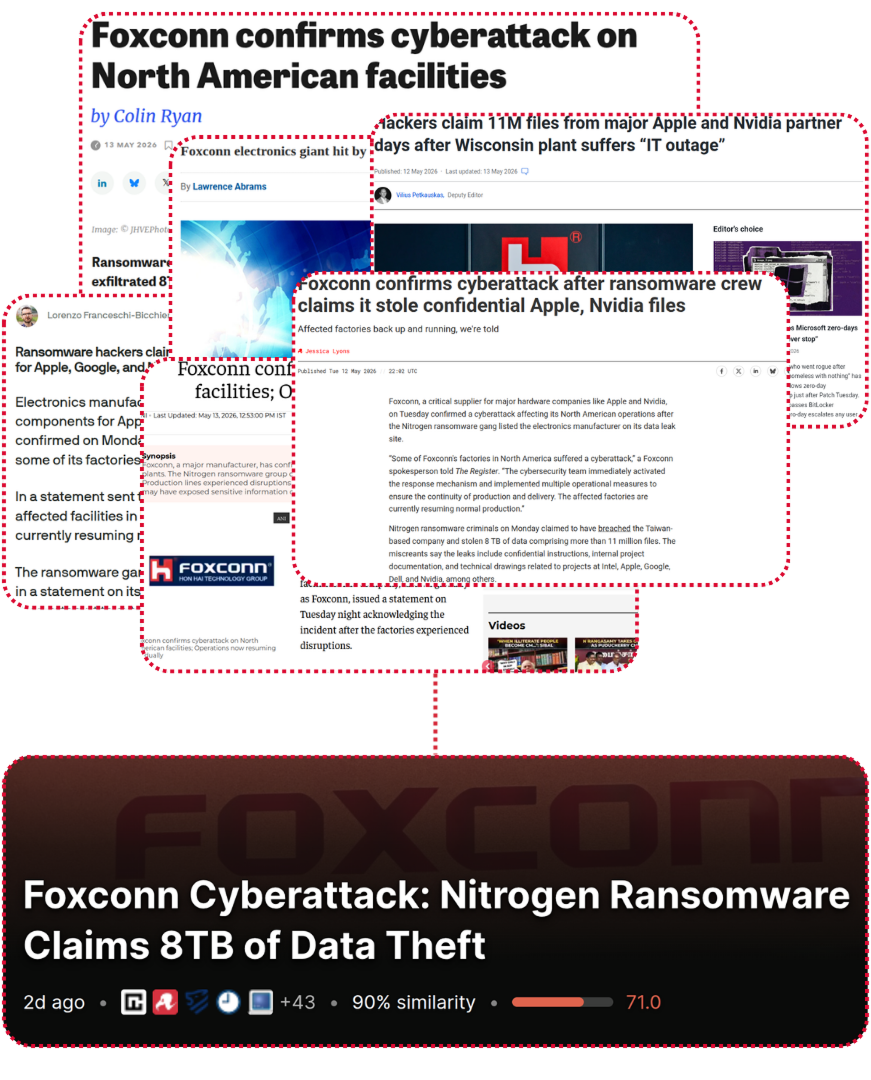
Threat reporting fragments across thirty outlets per incident. ThreatCluster groups related reporting using density-based semantic clustering, so what arrives is one scored cluster, not thirty alerts.
12,000 sources, density-based clustering.
Continuous ingestion from over 12,000 curated sources. Security vendors, government advisories, researcher blogs, news outlets, dark web forums, social platforms, and vulnerability databases all feed the same pipeline.
Every article goes through a multi-layer NLP pipeline that extracts entities, generates semantic embeddings, and groups related reporting using DBSCAN. Thirty articles about the same incident become one cluster, scored and enriched.
 click to expand
Enriched on landing.
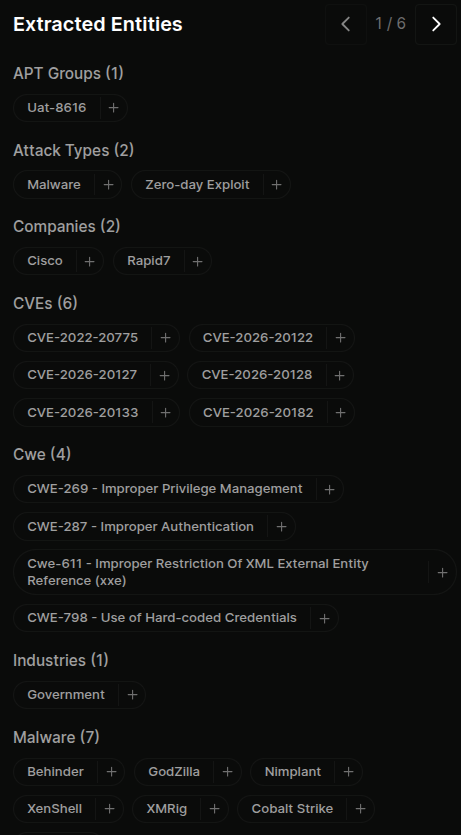
Every cluster auto-enriches with extracted entities. Threat actors, malware families, CVEs, CWEs, MITRE ATT&CK techniques, targeted industries, countries, platforms, tools, companies, and IOCs.
This entity layer is what makes custom feeds, threat models, and the entity intelligence pages possible. Every entity builds a living profile over time across every cluster it appears in.
 click to expand
Every cluster gets a threat score.
Each cluster is scored from 0 to 100 the moment it forms, so analysts can sort the morning feed by what actually matters and skip the noise.
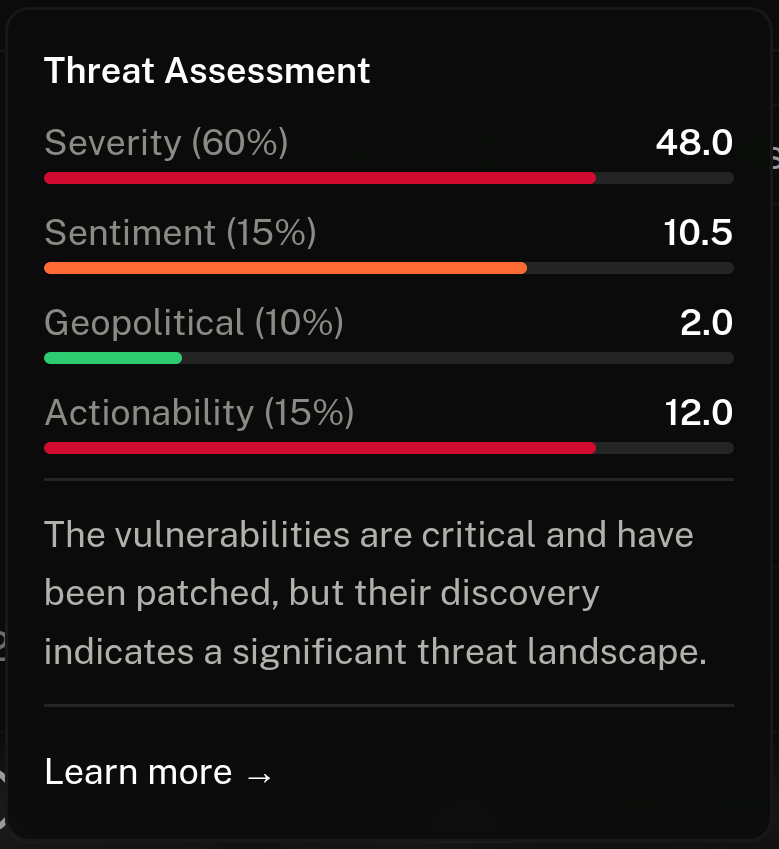
The composite blends four sub-scores so a single number reflects more than just severity:
- Severity — how bad the underlying threat is (60% of the composite)
- Sentiment — how urgent the reporting around it feels (15%)
- Geopolitical — state-sponsored, sanctions, critical infrastructure angle (10%)
- Actionability — whether there's a CVE, patch, IOC, or detection to work with (15%)
Each sub-score is calculated against the cluster's own articles, summary, and extracted entities, so the number reflects this incident rather than a sector-wide average. Two clusters covering "ransomware against healthcare" can still end up scored very differently if one names a CVE under active exploitation and the other is a quarterly research write-up.
 click to expand
Smart analysis on every cluster.
Four blocks per cluster, written by AI from the source articles and updated as new reporting lands. Read the cluster once, walk away knowing what happened and what to do about it.
- Summary — what happened, in plain English
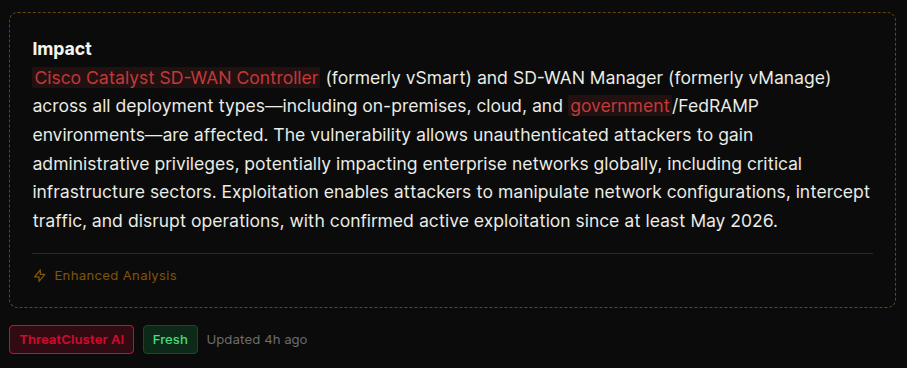
- Impact assessment — who's affected and how badly
- Technical details — the how, including affected versions, exploit conditions, and indicators
- Recommended response — the actions a defender should take next
Every concrete claim carries an inline citation back to the source article that supports it, so nothing in the analysis is unverifiable.
 click to expand
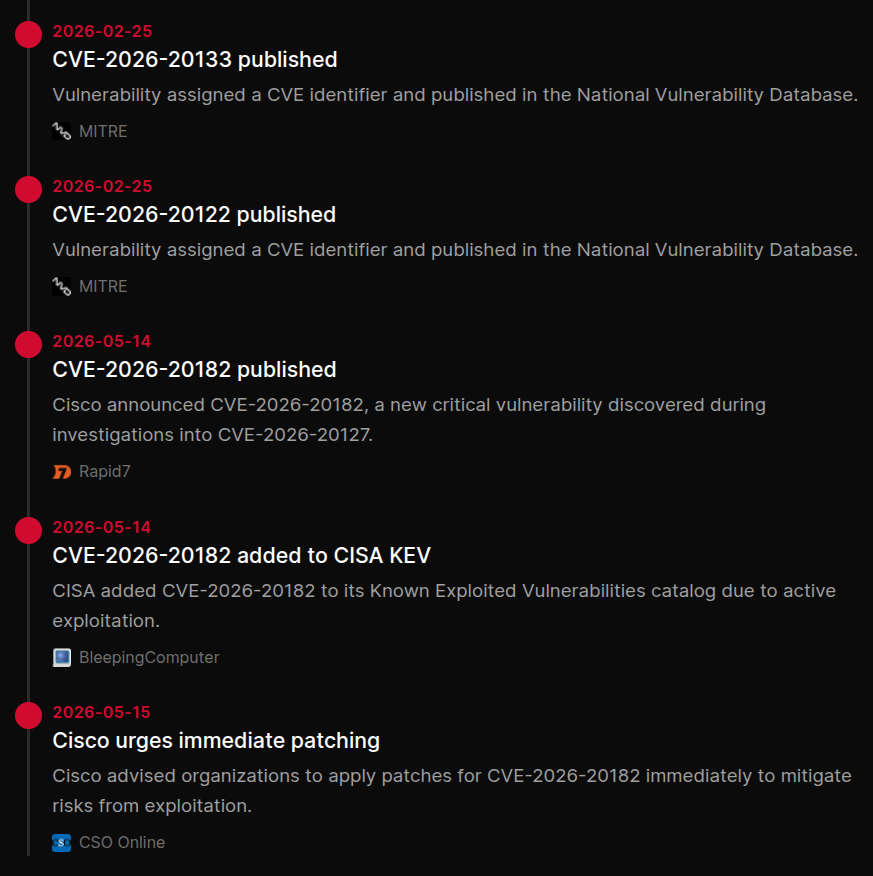
Sourced timeline of the incident.
A reconstructed timeline of events, drawn from every source article in the cluster and dated to when each thing actually happened, not when it was written about.
See how the incident unfolded in the order it occurred, which is rarely the order it was reported. Every entry links back to the article that supports it, so the chain of evidence is one click away.
 click to expand
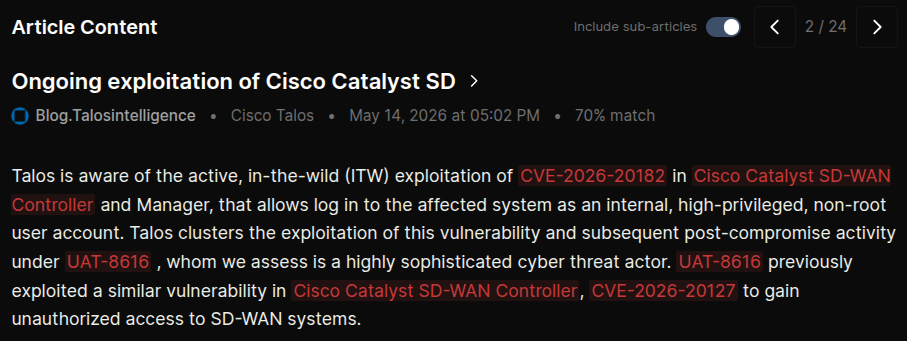
Source articles and sub-articles in line.
Cycle through every source article and sub-article without leaving the page. Sub-articles follow outbound links from the original reporting one level deep, so when a vendor advisory is referenced, the actual advisory text is one click away inside the cluster.
Each article shows source, publication date, similarity score, and the entities it contributed to the cluster. Reference-only articles surface for context but don't inflate the source count.
 click to expand
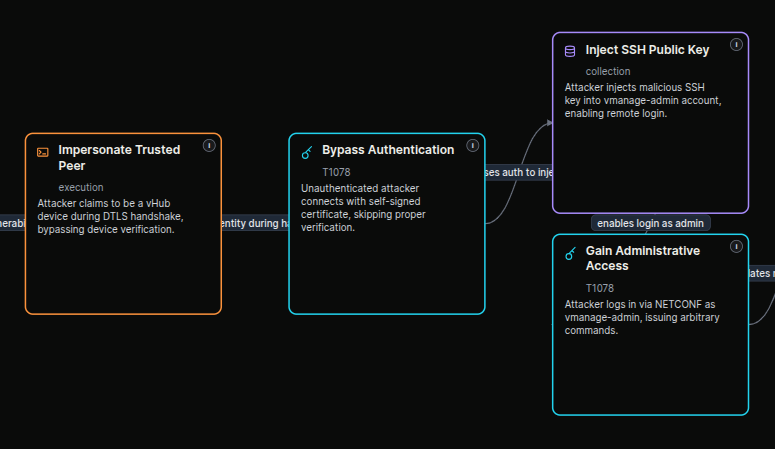
Attack flows on every cluster.
AI-generated kill chains per cluster, mapped to MITRE ATT&CK and structured to CTID Attack Flow v3. Each node cites the source material it came from, so the chain of evidence stays traceable end to end.
Flows regenerate as new reporting lands. Export as SVG, PNG, JSON, or STIX 2.1 to drop straight into a report, a tabletop exercise, or a downstream tool.
 click to expand
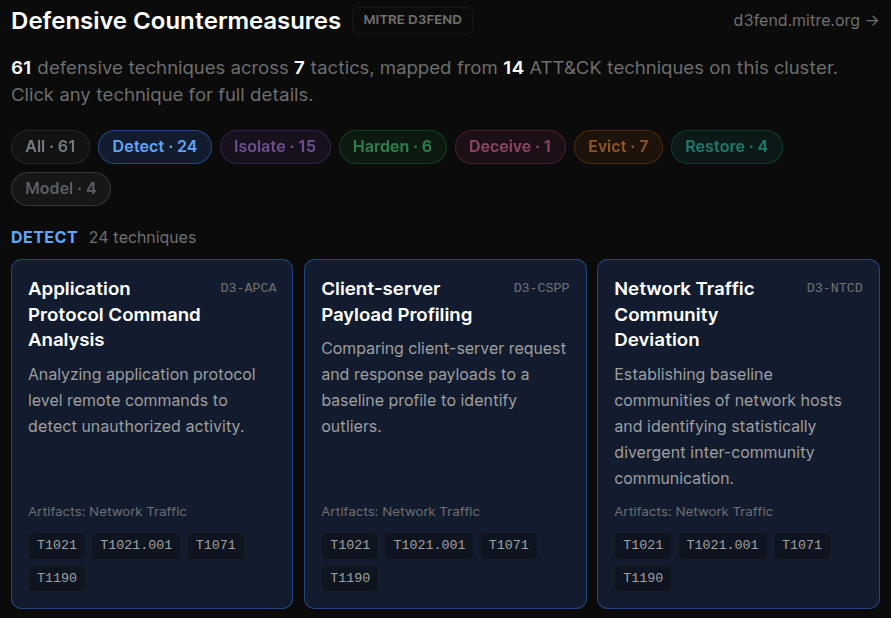
D3FEND countermeasures alongside.
Every step in the attack flow gets a matching defensive technique from MITRE D3FEND. Analysts see what to deploy, not just what to look for.
Useful for hardening conversations with clients, for prioritising the next control to roll out, and for showing leadership exactly which defences address which observed behaviour.
 click to expand
More of the platform
One incident,
one cluster, one decision.
Stop reading the same story thirty times. The feed is free to open and refreshes continuously.